Fibonacci numbers is a very popular tool among technical traders of stock, commodity and Forex trading. Herein the relationship of certain numbers is adjusted based on Fibonacci ratios and estimated the major peaks and bottoms based on these mathematics proportions.
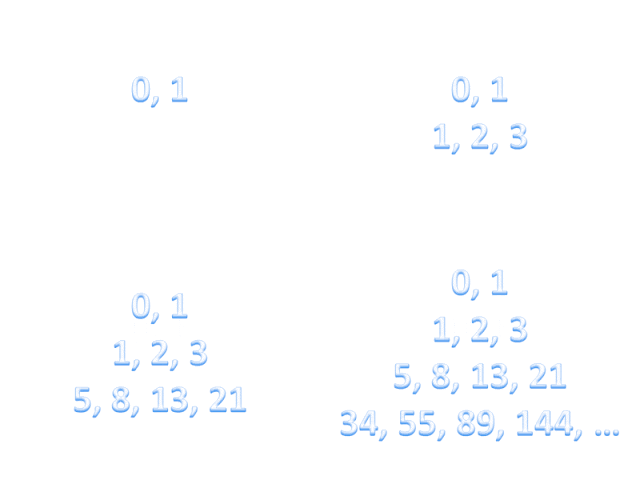
Italian number theorist Leonardo of Pisa recognize a specific sequence of mathematical numbers contain 0, 1, 1, 2, 3, 5, 8, 13, 21, 34, 55, 89 and so on. The important thing is that if every next number after 13 is divided by the last number so we'll get 0.618 value. Based on these numbers, as Fibonacci Levels 61.8 %, 50 %, and 38.2 % were identified.
Technical analyst estimates the trend's extend based on these numbers. On the technical chart the use of Fibonacci Levels is very easy. For this you have to draw a line from last bottom and then drag it till the next peak. Most of technical analysis software providing Fibonacci tools and these software is automatically split the distance between the bottom and the peak at ratio of 38.2 %, 50 % and 61.8 %.
This analysis should be done on the closing price basis and onto the line chart, many people draws the retracement line according to high and low levels of the candlestick.
When a stock is trading at record levels, then to identify the potential level Fibonacci extension is used. For this 161.8 %, 261.8 % and 423.6 % Fibonacci extension levels is seen.
When the price comes down a Fibonacci level and then turned and go back on the top of level again, So it's a sign of purchased.
For example if the stock price coming down from up trend momentum and goes below of the 38.2% level, but do not break the 50 % retracement level in terms of closing price basis, and after that if it go back again above the 38.2% level, so one can initiate the buy order here and you can set a stop loss on to the 50% level.
Similarly if the price breaks 50% level but do not break the 61.8% and after that price goes above the 50% level again, so here also you can execute your long position.
On the other hand for short sell you can use the above mention equation and vice versa.
If you are a day traders and want to execute trades based on Fibonacci so you can use 5 min ,15 min or 30 min chart. Herein you should use closed prices means draw a Fibonacci retracement on line chart.
Many day traders use well of Fibonacci, because on intraday trading you should have exact buy-sell level with proper stop loss.
Conclusion
Fibonacci retracement calculated for the very shorter term and also for long term trend chart. Fibonacci tools is suited for all type of financial instrument's technical analysis i.e Stock, Commodity, Forex.
Readers can scrutinize the Fibonacci method through demo trading before real trade with these Virtual Stock Game.
Follow us on facebook.com/ezstocktradingtips
Italian number theorist Leonardo of Pisa recognize a specific sequence of mathematical numbers contain 0, 1, 1, 2, 3, 5, 8, 13, 21, 34, 55, 89 and so on. The important thing is that if every next number after 13 is divided by the last number so we'll get 0.618 value. Based on these numbers, as Fibonacci Levels 61.8 %, 50 %, and 38.2 % were identified.
Technical analyst estimates the trend's extend based on these numbers. On the technical chart the use of Fibonacci Levels is very easy. For this you have to draw a line from last bottom and then drag it till the next peak. Most of technical analysis software providing Fibonacci tools and these software is automatically split the distance between the bottom and the peak at ratio of 38.2 %, 50 % and 61.8 %.
This analysis should be done on the closing price basis and onto the line chart, many people draws the retracement line according to high and low levels of the candlestick.
When a stock is trading at record levels, then to identify the potential level Fibonacci extension is used. For this 161.8 %, 261.8 % and 423.6 % Fibonacci extension levels is seen.
How to use Fibonacci Retracement Levels
When the price comes down a Fibonacci level and then turned and go back on the top of level again, So it's a sign of purchased.
For example if the stock price coming down from up trend momentum and goes below of the 38.2% level, but do not break the 50 % retracement level in terms of closing price basis, and after that if it go back again above the 38.2% level, so one can initiate the buy order here and you can set a stop loss on to the 50% level.
Similarly if the price breaks 50% level but do not break the 61.8% and after that price goes above the 50% level again, so here also you can execute your long position.
On the other hand for short sell you can use the above mention equation and vice versa.
Intraday Trade using Fibonacci Method
If you are a day traders and want to execute trades based on Fibonacci so you can use 5 min ,15 min or 30 min chart. Herein you should use closed prices means draw a Fibonacci retracement on line chart.
Many day traders use well of Fibonacci, because on intraday trading you should have exact buy-sell level with proper stop loss.
Conclusion
Fibonacci retracement calculated for the very shorter term and also for long term trend chart. Fibonacci tools is suited for all type of financial instrument's technical analysis i.e Stock, Commodity, Forex.
Readers can scrutinize the Fibonacci method through demo trading before real trade with these Virtual Stock Game.
Follow us on facebook.com/ezstocktradingtips


